Sentiment Outlook
Currency Futures & Forex Trading
Updated Weekends
Sentiment data compiled
from weekly
Commitments of Traders reports.
|
|
Sentiment Outlook Updated Weekends |
Sentiment data compiled
from weekly |
* Sentiment Outlook (To understand these charts and their meaning, click here for a description.)
* Other Forex Trading Tools
Unweighted
Major Currency Average (UMCA) & Currency Pair Strength
Elliott
Wave & Fibonacci Guide
![]()
Market Harmonic's
founder
Tony Carrion is now part of the team of Forex analysts at Elliott Wave
International. Learn
about EWI's round-the-clock intraday Forex market coverage.
Latest COT Data for: November 17, 2020
NOTE: COT hedging data is plotted inversely to visually parallel market movement. See explanatory notes below.
To learn more about Commitments of Traders (COT) data and how to read our charts, please click here for information.
Commercial
Hedger Positions
Large
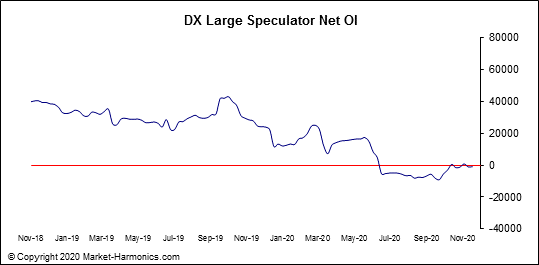
Speculators - US Dollar & Euro
Large
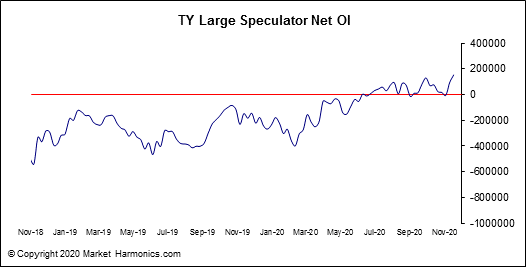
Speculators - 10 Year U.S. Treasury Notes
Commercial Hedger Positions
 |
 |
 |
 |
 |
 |
Large Speculator Sentiment - U.S. Dollar & Euro Futures
To learn more about Commitments of Traders (COT) data and how to read our charts, please click here for information.
USDX Futures Index


Euro Futures


10-Year Treasury Note Market Sentiment


Descriptions
One of the best measures of trader sentiment that can give an insight into Forex
trading patterns is to look at hedging activity in the currency futures
market. The Commodity Futures Trading Commission (CFTC) publishes on a weekly basis data
that reflects various trading positions held by commodity and futures traders
known as "Commitments of Traders" Reports (COT). It's important
to remember that the futures market exists for one central purpose - transference of
risk. That risk is transferred to speculators hoping to profit
from a rise or decline in a particular futures market contract. As it
relates to Forex, large, institutional and governmental FX traders all have risk
exposure to their positions in the Forex cash (i.e. "spot") market that they seek to
hedge by transferring that risk to others. "Commercials" are
defined by the CFTC as those who specifically use futures or options for the
purposes of hedging and risk management. Commercials have also been dubbed
the "smart money," because their position tends to give them a better
insight into the market, and in many cases, they are the
market.
We offer charts of the Commercial net long/net short hedging positions for the Australian Dollar (AD), British Pound (BP), Canadian Dollar (CD), Euro FX (EC), and Japanese Yen (JY). The data reflects volume of futures contracts traded on these currencies at the Chicago Mercantile Exchange (CME). The contracts are designed to reflect changes in the US dollar value of each currency, and contract values are quoted in US dollars. Consequently, if the value of one of these contracts rises, it means that it takes more US dollars to buy that currency; if the value declines, it takes less US dollars (i.e., the USD gains in value against it).
When studying the charts, here are a couple of things to keep in mind. To be classified as a Commercial, it means that the Commercial has an opposite position in the futures market than they have in the Forex market. Therefore, if they are net long a particular currency in the Forex market, they are net short that same currency in the futures market. In that sense, the Commercial position can be looked at as a contrarian indicator for the particular currency.
Secondly, different Commercials will be long or short the same currency in the futures market, so to determine where the greater Commercial strength lies, we look at their net short or long position, which is simply the difference between the volume of all Commercial contracts that are held long, and all those that are sold short. If the result is positive, then Commercials are primarily net long; if the result is negative, they are primarily net short. When they are net long, they are primarily buyers of the currency in the futures market (and sellers in the FX market). When they are net short, they are primarily sellers of the currency in the futures market (and buyers in the FX market). A cross above or below the zero line is the threshold to determine the net Commercial position. Note that we now plot the COT data inversely on our charts to visually parallel the Commercial net position with price action in the market. Consequently, if the COT chart data is rising, then market price for that currency against the USD also tends to be rising, and vice-versa. Also note that these charts look at the individual currency, not the currency pairs, where the USD may either be the base or cross currency.
ęCopyright 2020 Market-Harmonics.com. All content presented is the exclusive property of Market Harmonics. com, which is owned & operated by T. Carrion & Co., LLC, and may not be duplicated or distributed without the express written consent of the author.